lir.aggregation.metrics_bars module
- class lir.aggregation.metrics_bars.MetricsBarPlot(path: Path | None, metrics: Mapping[str, Callable[[LLRData], float | list[float]]])[source]
Bases:
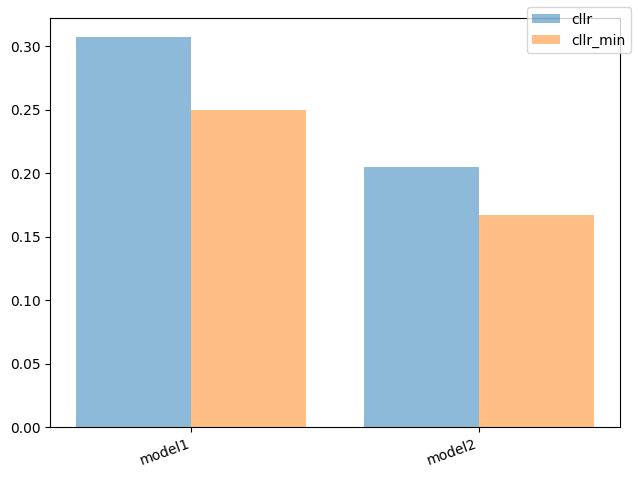
AggregationGenerate a bar plot for metrics and runs.
The plot shows a bar for each LR-system run and metric combination.
Usage example in YAML:
output:
  metric_bars:
    metrics:
      - cllr
      - cllr_min
- Parameters:
path (Path) – The path to where the plot file is written.
metrics (Mapping[str, Callable]) – A mapping of metric names to functions that compute the values for the metrics.
- report(data: AggregationData) None[source]
Write the metrics to a plot.
- Parameters:
data (AggregationData) – The data for which to compute metrics.