lir.aggregation package
- class lir.aggregation.Aggregation[source]
Bases:
ABCBase representation of an aggregated data collection.
Other classes may extend from this class.
- close() None[source]
Finalize the aggregation; no more results will come in.
The close method is called at the end of gathering the aggregation(s) to ensure files are closed, buffers are cleared, or other things that need to finish / tear down.
- abstractmethod report(data: AggregationData) None[source]
Report that new results are available.
- Parameters:
data (AggregationData) – The aggregated data to be reported.
- class lir.aggregation.AggregationData(llrdata: LLRData, lrsystem: LRSystem | None, parameters: dict[str, HyperparameterOption | str], run_name: str, experiment_output_dir: Path, run_output_dir: Path, get_full_fit_lrsystem: Callable[[], LRSystem] | None = None)[source]
Bases:
NamedTupleRepresentation of aggregated data.
- Parameters:
llrdata (LLRData) – The LLR data containing LLRs and labels.
lrsystem (LRSystem) – The model that produced the results.
parameters (dict[str, Any]) – Parameters that identify the system producing the results.
run_name (str) – String representation of the run that produced the results.
experiment_output_dir (Path) – The directory where the results should be stored for this experiment.
run_output_dir (Path) – The directory where the results should be stored for this run.
get_full_fit_lrsystem (Callable[[], LRSystem] | None) – Optional callable that lazily provides a model fitted on full data (ignoring splits).
- parameters: dict[str, HyperparameterOption | str]
Alias for field number 2
- resolve_path_for_experiment(filename: Path | PathLike | str) Path[source]
Obtain the full path for a filename and make sure it is a sub path of
experiment_output_dir.If the filename is an absolute path, or the filename is relative to
experiment_output_dir, return the filename as-is.Otherwise, construct a path for the filename relative to
experiment_output_dir.- Parameters:
filename (Path | PathLike | str) – A file or directory.
- Returns:
A path relative to the output directory for the experiment.
- Return type:
Path
- resolve_path_for_run(filename: Path | PathLike | str) Path[source]
Obtain the full path for a filename and make sure it is a sub path of
experiment_output_dir.If the filename is an absolute path, or the filename is relative to
experiment_output_dir, return the filename as-is.Otherwise, construct a path for the filename relative to
experiment_output_dir.- Parameters:
filename (Path | PathLike | str) – A file or directory.
- Returns:
A path relative to the output directory for the experiment.
- Return type:
Path
- class lir.aggregation.CaseLLRToCsv(case_data_provider: DataProvider, filename: str = 'case_llr.csv')[source]
Bases:
AggregationAggregation that applies a full-data-fitted LR system to case data and stores LLRs as CSV.
- Parameters:
case_data_provider (DataProvider) – Provider for the case data to apply the LR system to.
filename (str, optional) – Name of the output CSV file, by default ‘case_llr.csv’.
- report(data: AggregationData) None[source]
Apply the full-data-fitted LR system to the case data and store the resulting LLRs as CSV.
- Parameters:
data (AggregationData) – Aggregation data containing the fitted LR system and case data.
- class lir.aggregation.MetricsBarPlot(path: Path | None, metrics: Mapping[str, Callable[[LLRData], float | list[float]]], plot_params: dict[str, Any] | None = None)[source]
Bases:
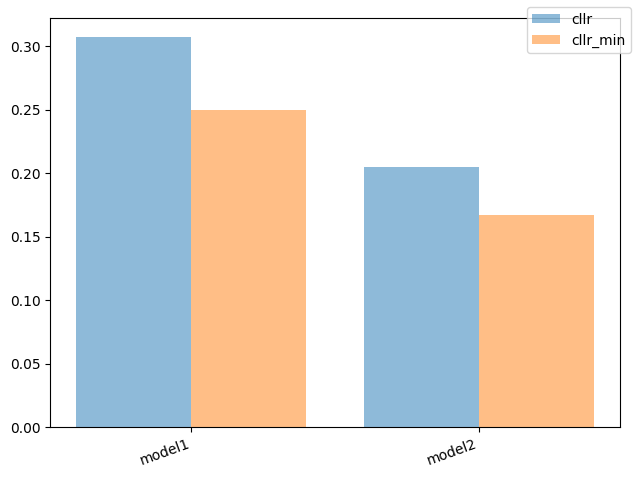
AggregationGenerate a bar plot for metrics and runs.
The plot shows a bar for each LR-system run and metric combination.
Usage example in YAML:
output:
  - method: metrics_bars
    plot_params:
      ylim: [null, 1]
      xlabel: run
    metrics:
      - cllr
      - cllr_min
- Parameters:
- report(data: AggregationData) None[source]
Write the metrics to a plot.
- Parameters:
data (AggregationData) – The data for which to compute metrics.
- class lir.aggregation.PlotEach(plot_fn: Callable, plot_name: str, **kwargs: Any)[source]
Bases:
AggregationAggregation that generates a plot for each call to
report().Repeated calls to
report()will result in separate plots.- Parameters:
plot_fn (Callable) – The plotting function to be used for generating plots.
plot_name (str) – The name of the plot.
**kwargs (Any) – Additional arguments to be passed to the plotting function.
- plot_fn
The plotting function to be used for generating plots.
- Type:
Callable
- report(data: AggregationData) None[source]
Plot the data when new results are available.
- Parameters:
data (AggregationData) – The aggregated data to be plotted.
- class lir.aggregation.SubsetAggregation(aggregation_methods: list[Aggregation], category_field: str)[source]
Bases:
AggregationAggregation method that manages data categorization.
This aggregation relies on a set of other aggregation methods which are called once for each category for each run. The category_field parameter refers to an attribute in the input data. It must be available as a numpy array of the same length as the number of instances, and its values are the categories of the instances.
The
AggregationDataattributes are adjusted accordingly:llrdata contains only instances of a single category.
lrsystem is unchanged.
parameters is modified to include the category field/value pair.
run_name is modified to include the category key/value pair, to make it unique within an experiment, even across categories.
experiment_output_dir is unchanged.
run_output_dir is modified to be unique within an experiment, even across categories.
In a configuration file, the aggregation is used in the
outputsection, and is referred to as by_category. Example of use:experiment: [...] output: by_category: category_field: my_category output: - metrics_csv
- Parameters:
aggregation_methods (list[Aggregation]) – A list of methods to aggregate results by category.
category_field (str) – The name of the category field.
- report(data: AggregationData) None[source]
Report that new results are available.
The data are categorized into subsets and forwarded to the actual aggregation method.
- Parameters:
data (AggregationData) – The aggregated data to be reported.
- class lir.aggregation.WriteMetricsToCsv(path: Path | str, columns: Mapping[str, Callable])[source]
Bases:
AggregationHelper class to write aggregated results to CSV file.
- Parameters:
path (Path) – The path to the CSV file where the metrics will be written.
columns (Mapping[str, Callable]) – A mapping of column names to metric functions that compute the values for those columns.
- report(data: AggregationData) None[source]
Write the metrics to CSV.
- Parameters:
data (AggregationData) – The aggregated data for which to compute and write the metrics.
Submodules
lir.aggregation.case_llr_csv module
- class lir.aggregation.case_llr_csv.CaseLLRToCsv(case_data_provider: DataProvider, filename: str = 'case_llr.csv')[source]
Bases:
AggregationAggregation that applies a full-data-fitted LR system to case data and stores LLRs as CSV.
- Parameters:
case_data_provider (DataProvider) – Provider for the case data to apply the LR system to.
filename (str, optional) – Name of the output CSV file, by default ‘case_llr.csv’.
- report(data: AggregationData) None[source]
Apply the full-data-fitted LR system to the case data and store the resulting LLRs as CSV.
- Parameters:
data (AggregationData) – Aggregation data containing the fitted LR system and case data.
lir.aggregation.metrics_bars module
- class lir.aggregation.metrics_bars.MetricsBarPlot(path: Path | None, metrics: Mapping[str, Callable[[LLRData], float | list[float]]], plot_params: dict[str, Any] | None = None)[source]
Bases:
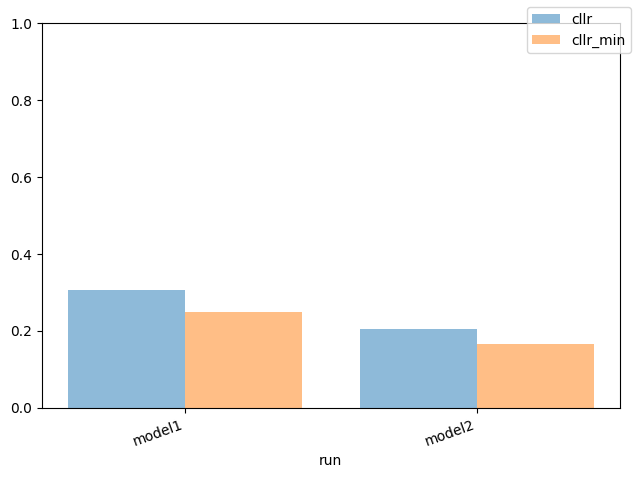
AggregationGenerate a bar plot for metrics and runs.
The plot shows a bar for each LR-system run and metric combination.
Usage example in YAML:
output:
  - method: metrics_bars
    plot_params:
      ylim: [null, 1]
      xlabel: run
    metrics:
      - cllr
      - cllr_min
- Parameters:
- report(data: AggregationData) None[source]
Write the metrics to a plot.
- Parameters:
data (AggregationData) – The data for which to compute metrics.
lir.aggregation.metrics_csv module
- class lir.aggregation.metrics_csv.WriteMetricsToCsv(path: Path | str, columns: Mapping[str, Callable])[source]
Bases:
AggregationHelper class to write aggregated results to CSV file.
- Parameters:
path (Path) – The path to the CSV file where the metrics will be written.
columns (Mapping[str, Callable]) – A mapping of column names to metric functions that compute the values for those columns.
- report(data: AggregationData) None[source]
Write the metrics to CSV.
- Parameters:
data (AggregationData) – The aggregated data for which to compute and write the metrics.
lir.aggregation.plot_each module
- class lir.aggregation.plot_each.PlotEach(plot_fn: Callable, plot_name: str, **kwargs: Any)[source]
Bases:
AggregationAggregation that generates a plot for each call to
report().Repeated calls to
report()will result in separate plots.- Parameters:
plot_fn (Callable) – The plotting function to be used for generating plots.
plot_name (str) – The name of the plot.
**kwargs (Any) – Additional arguments to be passed to the plotting function.
- plot_fn
The plotting function to be used for generating plots.
- Type:
Callable
- report(data: AggregationData) None[source]
Plot the data when new results are available.
- Parameters:
data (AggregationData) – The aggregated data to be plotted.
- class lir.aggregation.plot_each.PlotEachConfigParser(method: str, default_plot_name: str | None = None)[source]
Bases:
ConfigParserConfiguration parser for aggregate plots.
- Parameters:
- parse(config: ConfigValue, output_dir: Path) PlotEach[source]
Parse a configuration section for an aggregate plot.
- Parameters:
config (ConfigValue) – Configuration section.
output_dir (Path) – Output directory.
- Returns:
Parsed aggregate plot.
- Return type:
lir.aggregation.subset module
- class lir.aggregation.subset.SubsetAggregation(aggregation_methods: list[Aggregation], category_field: str)[source]
Bases:
AggregationAggregation method that manages data categorization.
This aggregation relies on a set of other aggregation methods which are called once for each category for each run. The category_field parameter refers to an attribute in the input data. It must be available as a numpy array of the same length as the number of instances, and its values are the categories of the instances.
The
AggregationDataattributes are adjusted accordingly:llrdata contains only instances of a single category.
lrsystem is unchanged.
parameters is modified to include the category field/value pair.
run_name is modified to include the category key/value pair, to make it unique within an experiment, even across categories.
experiment_output_dir is unchanged.
run_output_dir is modified to be unique within an experiment, even across categories.
In a configuration file, the aggregation is used in the
outputsection, and is referred to as by_category. Example of use:experiment: [...] output: by_category: category_field: my_category output: - metrics_csv
- Parameters:
aggregation_methods (list[Aggregation]) – A list of methods to aggregate results by category.
category_field (str) – The name of the category field.
- report(data: AggregationData) None[source]
Report that new results are available.
The data are categorized into subsets and forwarded to the actual aggregation method.
- Parameters:
data (AggregationData) – The aggregated data to be reported.